An approach to reducing energy & Water consumption
Visualization (BETA)
Seeing building data
Seeing
Step 1: Get the data
- Go to PG&E.com or your utility provider website.
- Navigate to the ShareMyData platform
- Download your electricity data in CSV format
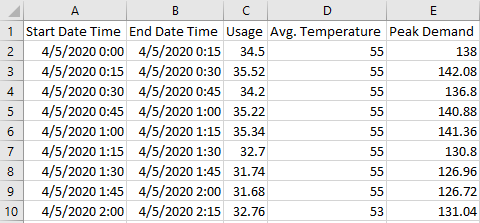
Step 2: Format the data
Data comes in many flavors. Format it the CSV in the following format to process the data.


Step 3: Upload data
Drag the utility data below
Drop csv file here
📁
📁
OR
Upload sample set here
Sample Office Data selected
Sample Lab Data selected
Step 4: See it
Over Time
Relationship to weather
All
Week
Work Hours
Weekend
Relationship to time of day
Week
Weekend
Data Summary
Data Range: -
Data Duration: days
Total Consumption: kWh
What it means
Over Time
Coming soon.
Monthly Calendar
Coming soon.
Scatter
Coming soon.
Hourly
Coming soon.
